Deploying Prometheus Pushgateway for Jobs and Hard-to-Scrape Metrics
Deploying Prometheus Pushgateway for Jobs and Hard-to-Scrape Metrics
Prometheus normally collects metrics by sending requests to an exporter or application endpoint. That model does not work in every environment. A monitoring source may be located behind a firewall, or a service may not expose an endpoint that Prometheus can scrape directly.
Pushgateway provides a bridge for these cases. The monitored source actively sends its metrics to Pushgateway, while Prometheus periodically scrapes the Pushgateway endpoint. This allows the metrics to enter the normal Prometheus workflow and remain available for alerting and visualization.
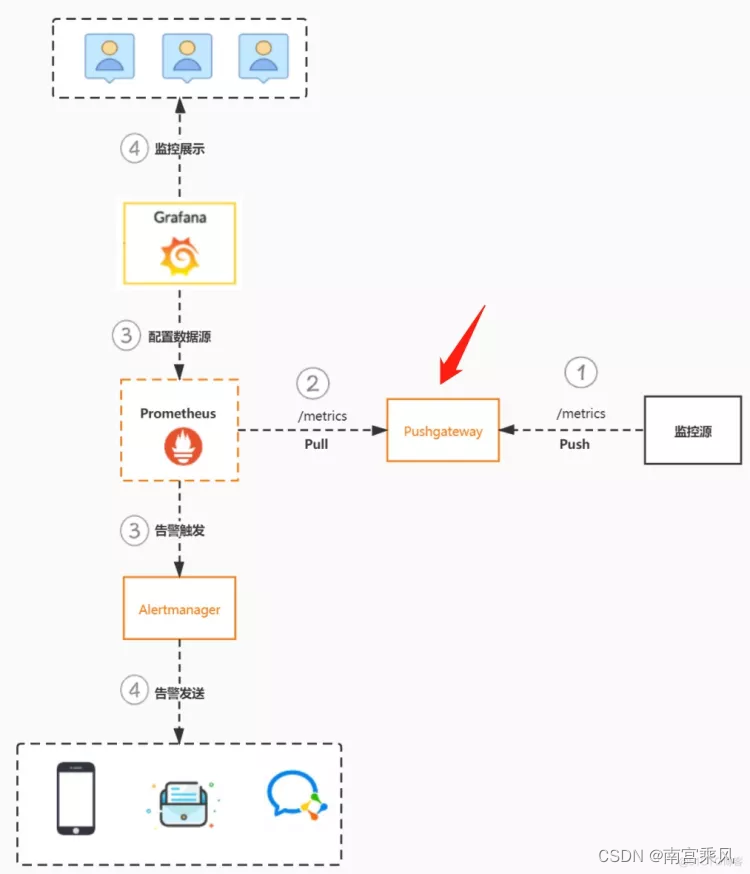
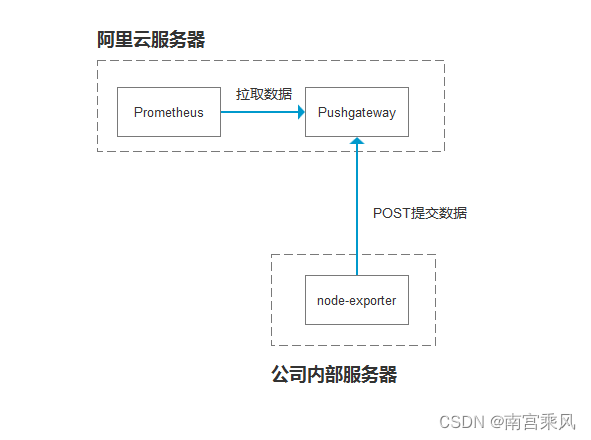
The general workflow is:
- A monitoring source sends data to Pushgateway with a POST request at
/metrics. - Prometheus is configured with a scrape job that periodically reads the metrics stored in Pushgateway.
- Prometheus evaluates the collected metrics against its alerting rules. Matching rules send alerts to Alertmanager, while Grafana can use Prometheus as a data source for dashboards.
- Alertmanager routes alerts to the configured recipients and delivery channels. Grafana users can build charts based on the metrics queried from Prometheus.
Installing Pushgateway
Download the binary package
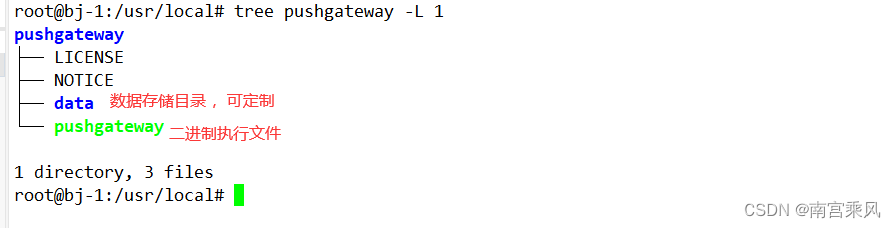
The following example installs Pushgateway under /usr/local:
cd /usr/local
wget https://github.com/prometheus/pushgateway/releases/download/v1.4.3/pushgateway-1.4.3.linux-amd64.tar.gz
tar -xf pushgateway-1.4.3.linux-amd64.tar.gz
Create a systemd service
Pushgateway listens on port 9091 by default. The listening port can be changed with --web.listen-address.
Create /usr/lib/systemd/system/pushgateway.service:
[Unit]
Description=Prometheus pushgateway
Requires=network.target remote-fs.target
After=network.target remote-fs.target

[Service]
Type=simple
User=root
Group=root
ExecStart=/usr/local/pushgateway/pushgateway --persistence.file="/usr/local/pushgateway/data/" --persistence.interval=5m
#保存时间5分钟
ExecReload=/bin/kill -HUP $MAINPID
KillMode=process
Restart=on-failure
RestartSec=5s

[Install]
WantedBy=multi-user.target
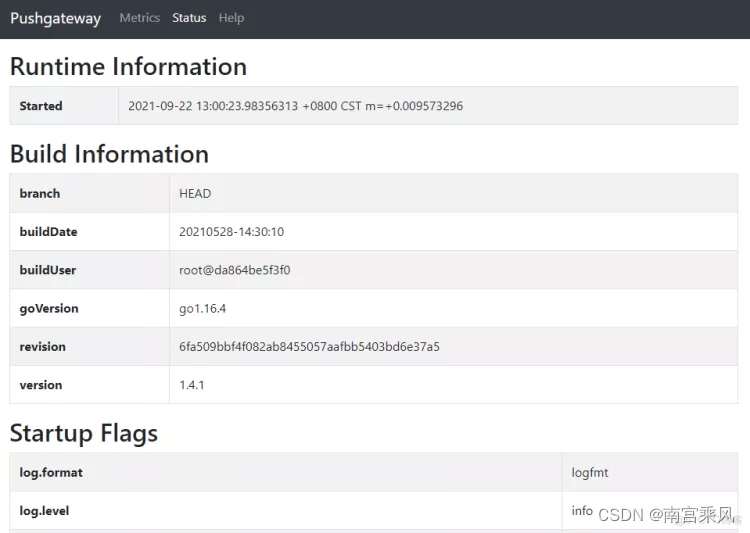
After creating the service, reload systemd and start Pushgateway according to the normal systemd procedure. The service definition stores data under /usr/local/pushgateway/data/ and uses a five-minute persistence interval.
Add Pushgateway to Prometheus
Add a new scrape job to /usr/local/prometheus/prometheus.yml:
- job_name: 'pushgateway'
  scrape_interval: 30s
  honor_labels: true
  #加上此配置exporter节点上传数据中的一些标签将不会被pushgateway节点的相同标签覆盖
  static_configs:
  - targets: ['10.3.1.11:9091']
    labels:
      instance: pushgateway
The honor_labels: true option prevents labels supplied by an exporter from being replaced by identical labels applied at the Pushgateway target. After reloading Prometheus, check the target page to confirm that the Pushgateway endpoint is up.

Sending metrics to Pushgateway
There are two common approaches: use a Prometheus client SDK, or send metrics through the Pushgateway HTTP API.
Push with a Prometheus client SDK
Prometheus provides client libraries for several languages. The officially supported options include Go, Java or Scala, Python, and Ruby. Many third-party client libraries are also available.
The following Python example creates a temporary registry, defines a Gauge metric, assigns labels, and sends the result to Pushgateway:
from prometheus_client import Counter,Gauge,push_to_gateway
from prometheus_client.core import CollectorRegistry
registry = CollectorRegistry()
data1 = Gauge('gauge_test_metric','This is a gauge-test-metric',['method','path','instance'],registry=registry)
data1.labels(method='get',path='/aaa',instance='instance1').inc(3)
push_to_gateway('10.12.61.3:9091', job='alex-job',registry=registry)
Here, gauge_test_metric is the metric name, This is a gauge-test-metric is its help text, and method, path, and instance are the labels. The value associated with the selected label set is increased by 3. The job argument identifies the pushed task.
The resulting exposition format is equivalent to:
# HELP gauge_test_metric This is a gauge-test-metric
# TYPE gauge_test_metric gauge
gauge_test_metric{instance="instance1",method="get",path="/aaa"} 3.0
Push node_exporter data through the API
Once node_exporter is installed, its /metrics output can be piped directly into Pushgateway. Labels are included in the URL path and are attached to the pushed data:
curl 127.0.0.1:9100/metrics|curl --data-binary @- http://10.3.1.11:9091/metrics/job/test/instance/10.2.1.11/hostname/ip-10-2-1-11
In this example, the pushed series receives labels corresponding to job=test, instance=10.2.1.11, and hostname=ip-10-2-1-11.
A script can wrap the operation so it can be run by cron. For example, node_date.sh:
#!/bin/bash
job_name="Bj"
hostname=$(hostname)
HOST_IP=$(hostname --all-ip-addresses | awk '{print $1}')
/usr/bin/curl 127.0.0.1:9100/metrics|/usr/bin/curl --data-binary @- http://sanming.f3322.net:9091/metrics/job/$job_name/instance/$HOST_IP/hostname/$hostname
A cron entry can run the script once per minute:
#Ansible: node_date
* * * * * /bin/bash /usr/local/node_exporter/node_date.sh
To distribute the script and schedule to multiple node_exporter hosts, an Ansible playbook can be used:
- hosts: all
  remote_user: root
  gather_facts: no
  tasks:
  - name: 推送磁盘脚本
    copy: src=node_date.sh dest=/usr/local/node_exporter mode=u+x
  - name: 设置定时任务
    cron: name="node_date" job="/bin/bash /usr/local/node_exporter/node_date.sh" state="present"
  - name: 执行脚本
    shell: /bin/bash /usr/local/node_exporter/node_date.sh
To remove the data associated with a particular grouping key, send a DELETE request using the same path labels:
curl -X DELETE http://10.3.1.11:9091/metrics/job/test/instance/10.2.1.11/hostname/ip-10-2-1-11
Writing a custom Pushgateway collection script
Pushgateway does not collect operating-system or application metrics by itself. It waits for another process to send data to it, so custom measurements require a collection script or another client.
Example: count TCP connections in a wait state
The following script calculates the number of TCP entries whose state contains wait, then submits the value to the local Pushgateway instance:
mkdir -p /app/scripts/pushgateway
cat <<EOF >/app/scripts/pushgateway/tcp_waiting_connection.sh
#!/bin/bash
# 获取hostname,且host不能为localhost
instance_name=`hostname -f | cut -d '.' -f 1`
if [ $instance_name = "localhost" ];then
 echo "Must FQDN hostname"
 exit 1
fi
# For waiting connections
label="count_netstat_wait_connetions"
count_netstat_wait_connetions=`netstat -an | grep -i wait | wc -l`
echo "$label:$count_netstat_wait_connetions"
echo "$label $count_netstat_wait_connetions" | curl --data-binary @- http://localhost:9091/metrics/job/pushgateway/instance/$instance_name
EOF
chmod +x /app/scripts/pushgateway/tcp_waiting_connection.sh
The command netstat -an | grep -i wait | wc -l determines the value of the custom metric. The script then sends the key/value pair to Pushgateway in the request body. In the URL, job/pushgateway identifies the job label, while instance/$instance_name identifies the instance label. These values are exposed as grouping labels for the pushed data, corresponding to an exported job such as pushgateway and an exported instance such as deepin-PC.
Schedule the script with cron:
* * * * * /app/scripts/pushgateway/tcp_waiting_connection.sh >/dev/null 2>&1
Prometheus commonly scrapes Pushgateway every 15 seconds, whereas cron's minimum standard interval is one minute. If the script needs to run every 15 seconds, one option is to define several cron entries with sleep offsets:
* * * * * /app/scripts/pushgateway/tcp_waiting_connection.sh >/dev/null 2>&1
* * * * * * sleep 15; /app/scripts/pushgateway/tcp_waiting_connection.sh >/dev/null 2>&1
* * * * * * sleep 30; /app/scripts/pushgateway/tcp_waiting_connection.sh >/dev/null 2>&1
* * * * * * sleep 45; /app/scripts/pushgateway/tcp_waiting_connection.sh >/dev/null 2>&1
Another option is to let the script loop four times at 15-second intervals, while cron invokes it only once per minute:
cat <<EOF >/app/scripts/pushgateway/tcp_waiting_connection.sh
#!/bin/bash
time=15
for (( i=0; i<60; i=i+time )); do
instance_name=`hostname -f | cut -d '.' -f 1`
if [ $instance_name = "localhost" ];then
 echo "Must FQDN hostname"
 exit 1
fi
label="count_netstat_wait_connetions"
count_netstat_wait_connetions=`netstat -an | grep -i wait | wc -l`
echo "$label:$count_netstat_wait_connetions"
echo "$label $count_netstat_wait_connetions" | curl --data-binary @- http://localhost:9091/metrics/job/pushgateway/instance/$instance_name
sleep $time
done
exit 0
EOF
The corresponding cron entry remains:
* * * * * /app/scripts/pushgateway/tcp_waiting_connection.sh >/dev/null 2>&1
When the script uses #!/bin/bash, run it during testing with an absolute path, a relative path, or bash /app/scripts/pushgateway/tcp_waiting_connection.sh. If the interpreter is #!/bin/sh, use sh /app/scripts/pushgateway/tcp_waiting_connection.sh; otherwise, Bash-specific syntax such as the for loop may produce the error Syntax error: Bad for loop variable.
The resulting metric can be queried in Prometheus as count_netstat_wait_connetions. A more complete version of the script uses the metric name count_netstat_wait_connections and pushes it to a job named pushgateway_test:
vi count_netstat_wait_connections.sh
#!/bin/bash
instance_name=`hostname -f | cut -d'.' -f1` #获取本机名,用于后面的的标签
label="count_netstat_wait_connections" #定义key名
count_netstat_wait_connections=`netstat -an | grep -i wait | wc -l` #获取数据的命令
echo "$label: $count_netstat_wait_connections"
echo "$label $count_netstat_wait_connections" | curl --data-binary @- http://server.com:9091/metrics/job/pushgateway_test/instance/$instance_name #这里pushgateway_test就是prometheus主配置文件里job的名字,需要保持一致,这样数据就会推送给这个job。后面的instance则是指定机器名,使用的就是脚本里获取的那个变量值
TCP connections in states such as CLOSE_WAIT and TIME_WAIT can be useful when investigating network, server, or database load. A high number of wait-state connections may indicate a problem involving traffic volume, request load, DDoS traffic, database activity, CPU pressure, or other system conditions. The same type of information may also be obtained through node_exporter, but a custom script allows the measurement and label structure to be defined directly.