How to Visualize MySQL Metrics in Grafana with Prometheus
To display MySQL monitoring data in Grafana, there are two main steps:
- Enable the dashboard path in Grafana and download a MySQL monitoring dashboard template.
- Import the corresponding JSON dashboard file from the Grafana web interface.
Enable dashboard loading and prepare the MySQL dashboard
A ready-made dashboard template can be used for MySQL monitoring. These JSON files act as dashboard definitions created in advance, so you do not need to build every panel manually.
Reference:
https://github.com/percona/grafana-dashboards
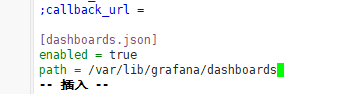
Add the following lines to the end of the Grafana configuration file:
<table> <thead> <tr> <th>1 2 3 4</th>
<th>vim /etc/grafana/grafana.ini [dashboards.json] enabled = true path = /var/lib/grafana/dashboards</th>
</tr>
</thead>
<tbody>
<tr>
<td></td>
<td></td>
</tr>
</tbody>
</table>
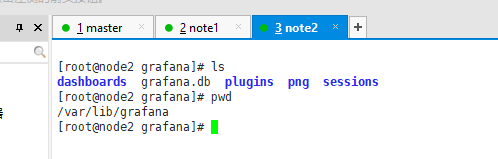
Then download the dashboard template:
<table> <thead> <tr> <th>1</th>
<th>cd /var/lib/grafana/</th>
</tr>
</thead>
<tbody>
<tr>
<td></td>
<td></td>
</tr>
</tbody>
</table>
<table>
<thead>
<tr>
<th>1</th>
<th>git clone https://github.com/percona/grafana-dashboards.git</th>
</tr>
</thead>
<tbody>
<tr>
<td></td>
<td></td>
</tr>
</tbody>
</table>
<table>
<thead>
<tr>
<th>1</th>
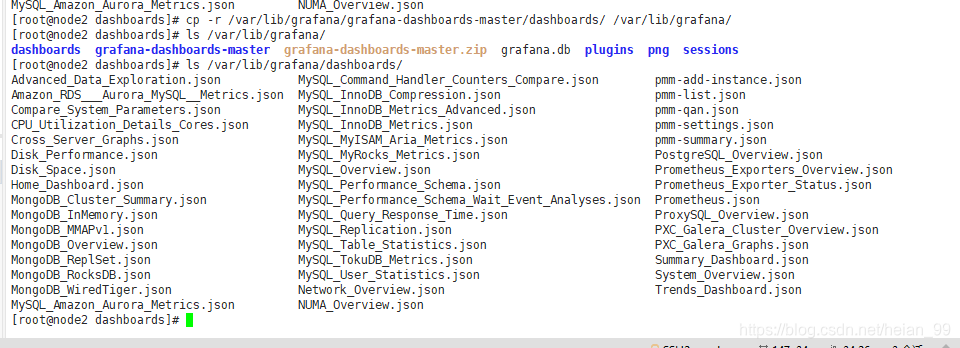
<th>cp -r /var/lib/grafana/grafana-dashboards-master/dashboards/ /var/lib/grafana/</th>
</tr>
</thead>
<tbody>
<tr>
<td></td>
<td></td>
</tr>
</tbody>
</table>
After that, restart the Grafana service:
<table> <thead> <tr> <th>1</th>
<th>systemctl restart grafana-server</th>
</tr>
</thead>
<tbody>
<tr>
<td></td>
<td></td>
</tr>
</tbody>
</table>
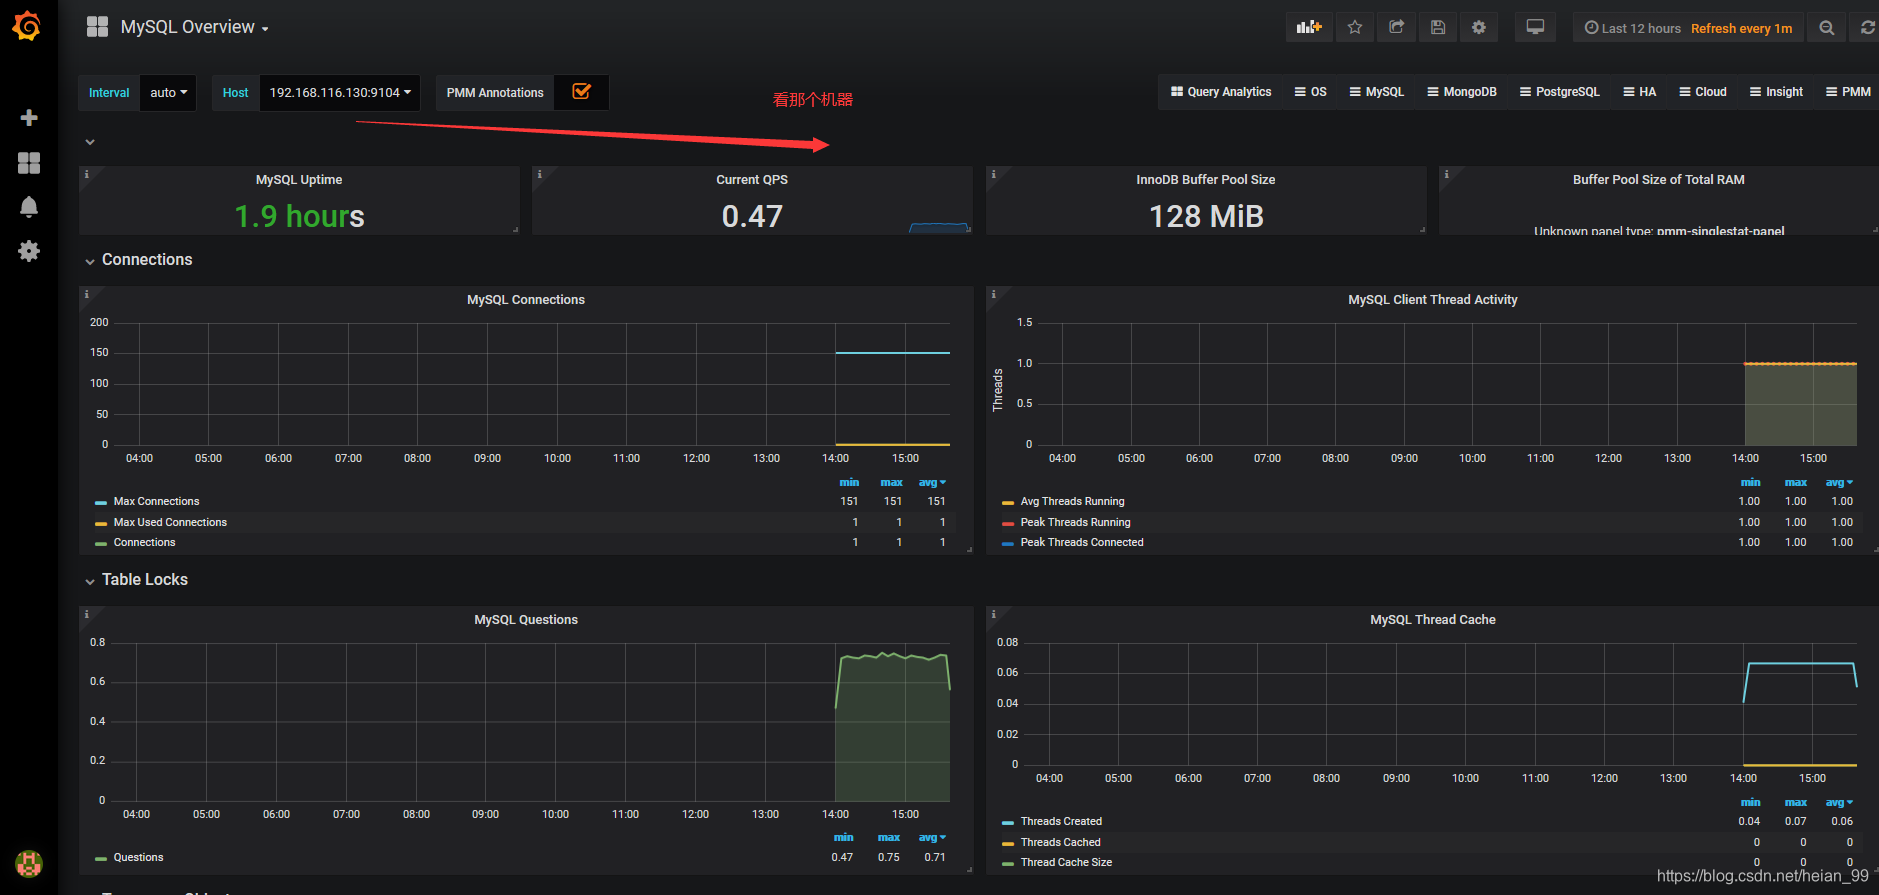
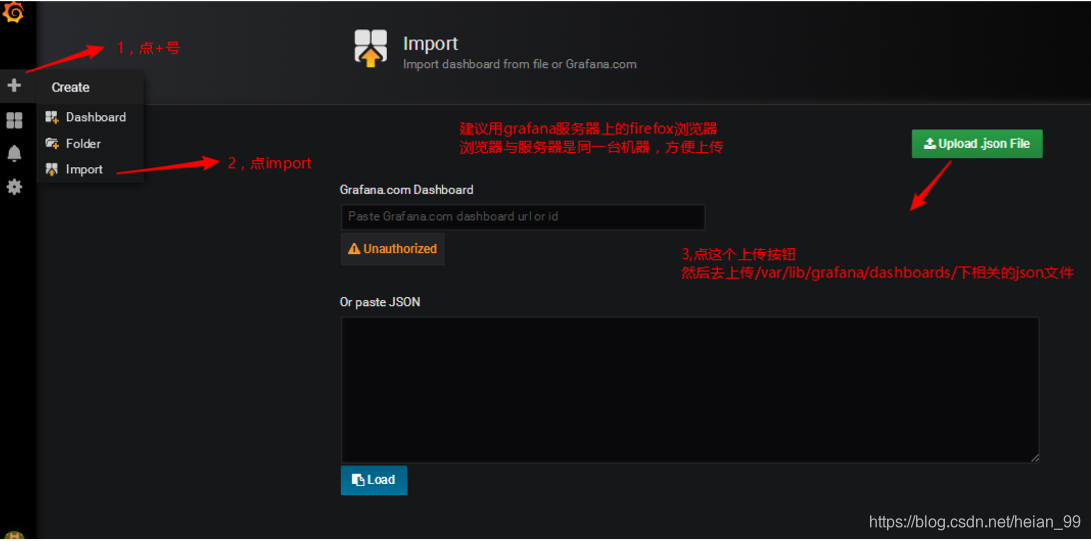
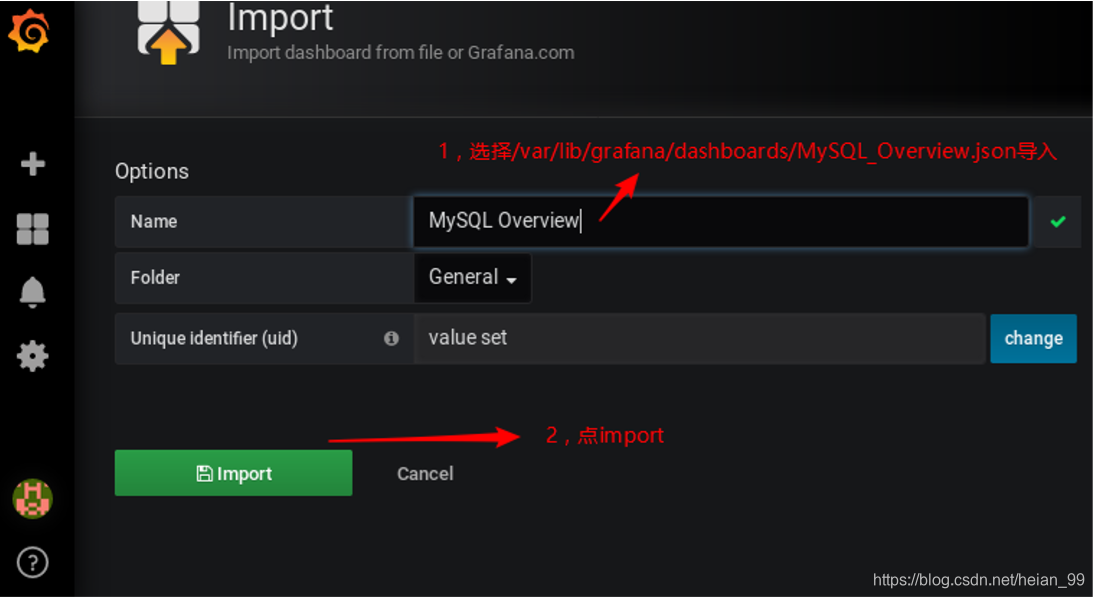
Import the JSON dashboard in Grafana
Once Grafana is restarted, open the web interface and import the dashboard JSON file.
If Grafana cannot find the Prometheus data source
A common issue appears after clicking Import: Grafana reports that the Prometheus data source cannot be found.
This happens because the JSON dashboard files are set to use a data source named Prometheus by default, while the existing data source may have been created under a different name such as prometheus_data.
The fix is simple: rename the original prometheus_data data source to Prometheus.
Be careful with the capitalization: the first letter must be uppercase P.
After renaming it, go back and refresh the dashboard. The MySQL monitoring data should then appear normally.