How to Remote Debug Java Applications in IntelliJ IDEA
Why remote debugging matters
Debugging in a distributed system is rarely straightforward. A single issue may involve multiple services, modules, threads, and environment-specific configurations. In many teams, the fallback approach is still to add logs, redeploy the service, reproduce the problem, then inspect the output. That works, but it is slow, repetitive, and can even introduce new issues while trying to diagnose the original one.
Another common headache is the mismatch between local and deployed behavior. Code may look perfectly fine during local debugging, yet once it is packaged and deployed to a test environment, unexpected problems start appearing. Differences in runtime configuration, server environment, or service interactions often explain why.
This is exactly where remote debugging becomes useful. With IntelliJ IDEA, you can attach your local IDE to a Java process running on a remote server and debug it almost as if it were running on your own machine. You can pause execution at breakpoints, inspect variables, and view the call stack without going through repeated redeploy cycles.
Before you start
Make sure the basics are already in place:
- IntelliJ IDEA is installed and configured properly.
- A JDK is available in your development environment.
- The Java application has already been deployed to the remote server.
- The remote service is reachable so that a debug connection can be established.
Start the server with remote debug enabled
A Java application must be started with specific JVM parameters before IntelliJ IDEA can attach to it remotely.
Use the following parameters when launching the server-side application:
-Xdebug
-Xrunjdwp:transport=dt_socket,suspend=n,server=y,address=${debug_port}
Or:
-Xdebug
-Xrunjdwp:transport=dt_socket,suspend=n,server=y,address=127.0.0.1:5555
If address is set to 127.0.0.1:5555, the debug port is restricted to local access only, which means external remote connections cannot reach it.
${debug_port} is a user-defined port. In the examples here, port 5005 is used.
If you are only debugging temporarily, it is better not to bind the port to a restrictive IP before the port number, so that the IDE can connect as needed. Once debugging is finished, remove the JVM debug parameters and redeploy the application. Leaving a remote debug port open can create a security risk.
Example startup command:
java -Dspring.config.location=application-pre.yml -Xdebug -Xrunjdwp:transport=dt_socket,address=5005,server=y,suspend=n -jar fubaodai-app-1.0-SNAPSHOT.jar
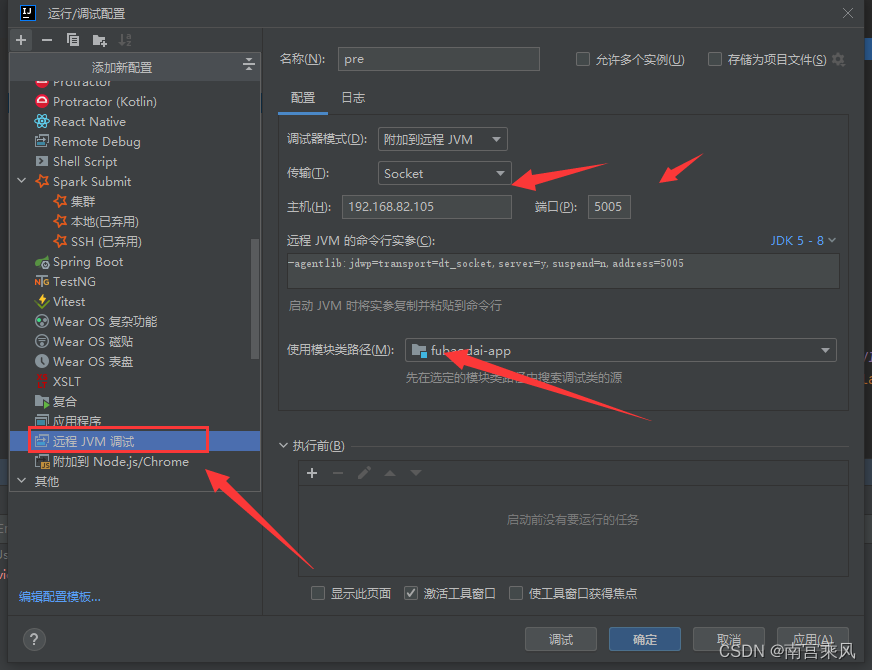
Create a remote debug configuration in IntelliJ IDEA
After the application is listening for debug connections, configure IntelliJ IDEA to attach to it:
- Open Run/Debug Configurations.
- Click the + button.
- Choose Remote.
- Enter the connection details for the remote server, such as the server IP, port, and debug protocol.
- Save the configuration.
In practice, the most important values are the host and the debug port you exposed when starting the JVM.

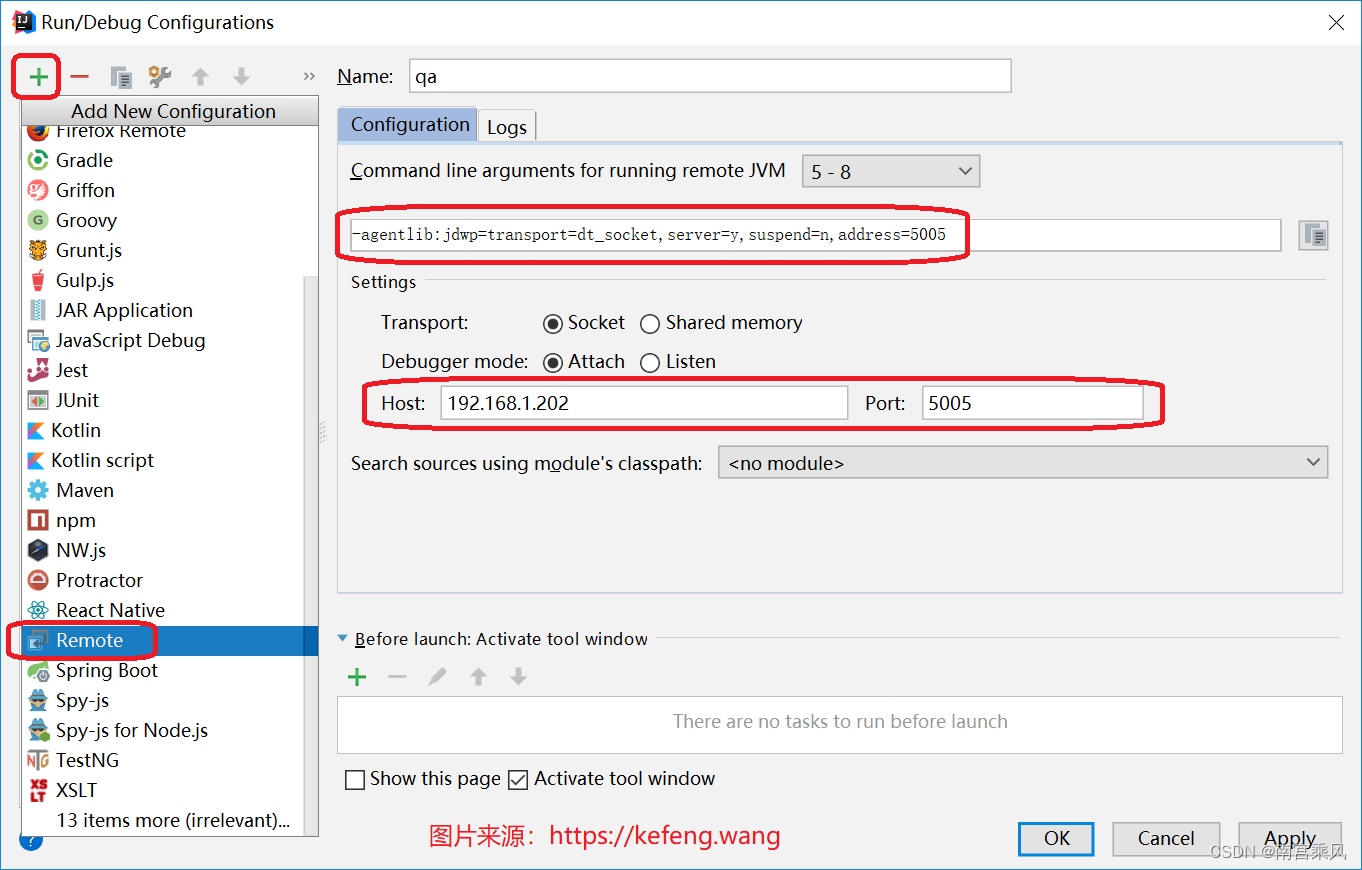
Or use the standard Remote template:
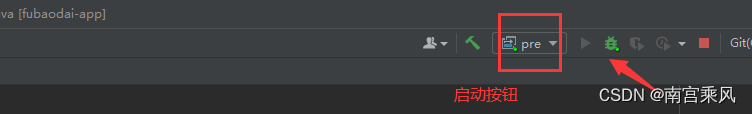
Attach from your local IDEA instance
Once the remote configuration is ready, start it from IntelliJ IDEA in debug mode.
One requirement is critical: the code on your local machine must match the code running on the remote server. If the two sides are out of sync, remote debugging may fail to attach correctly, or the breakpoints may not behave as expected.
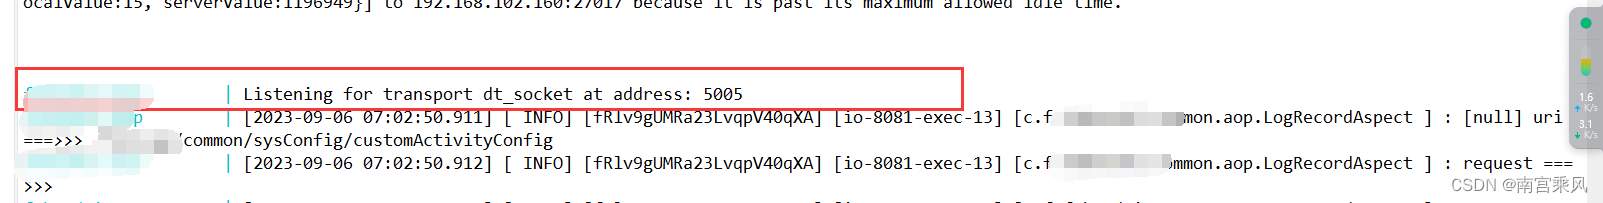
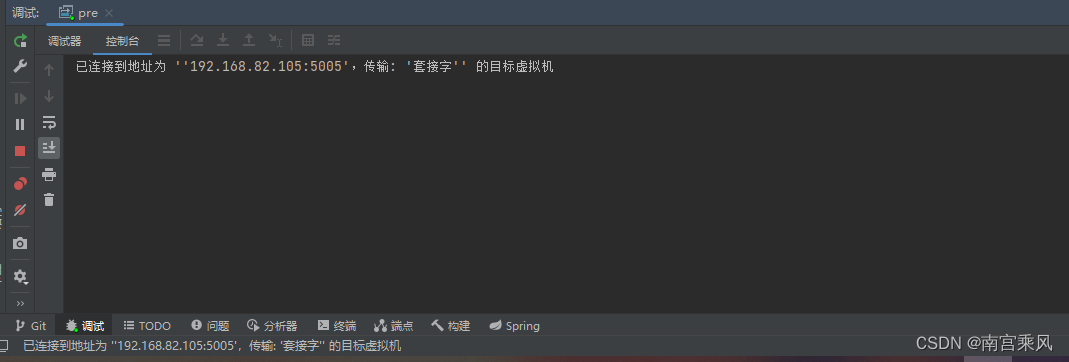
When the connection succeeds, IntelliJ IDEA will show a message like this:
Connected to the target VM, address: 'xxx:5005', transport: 'socket'
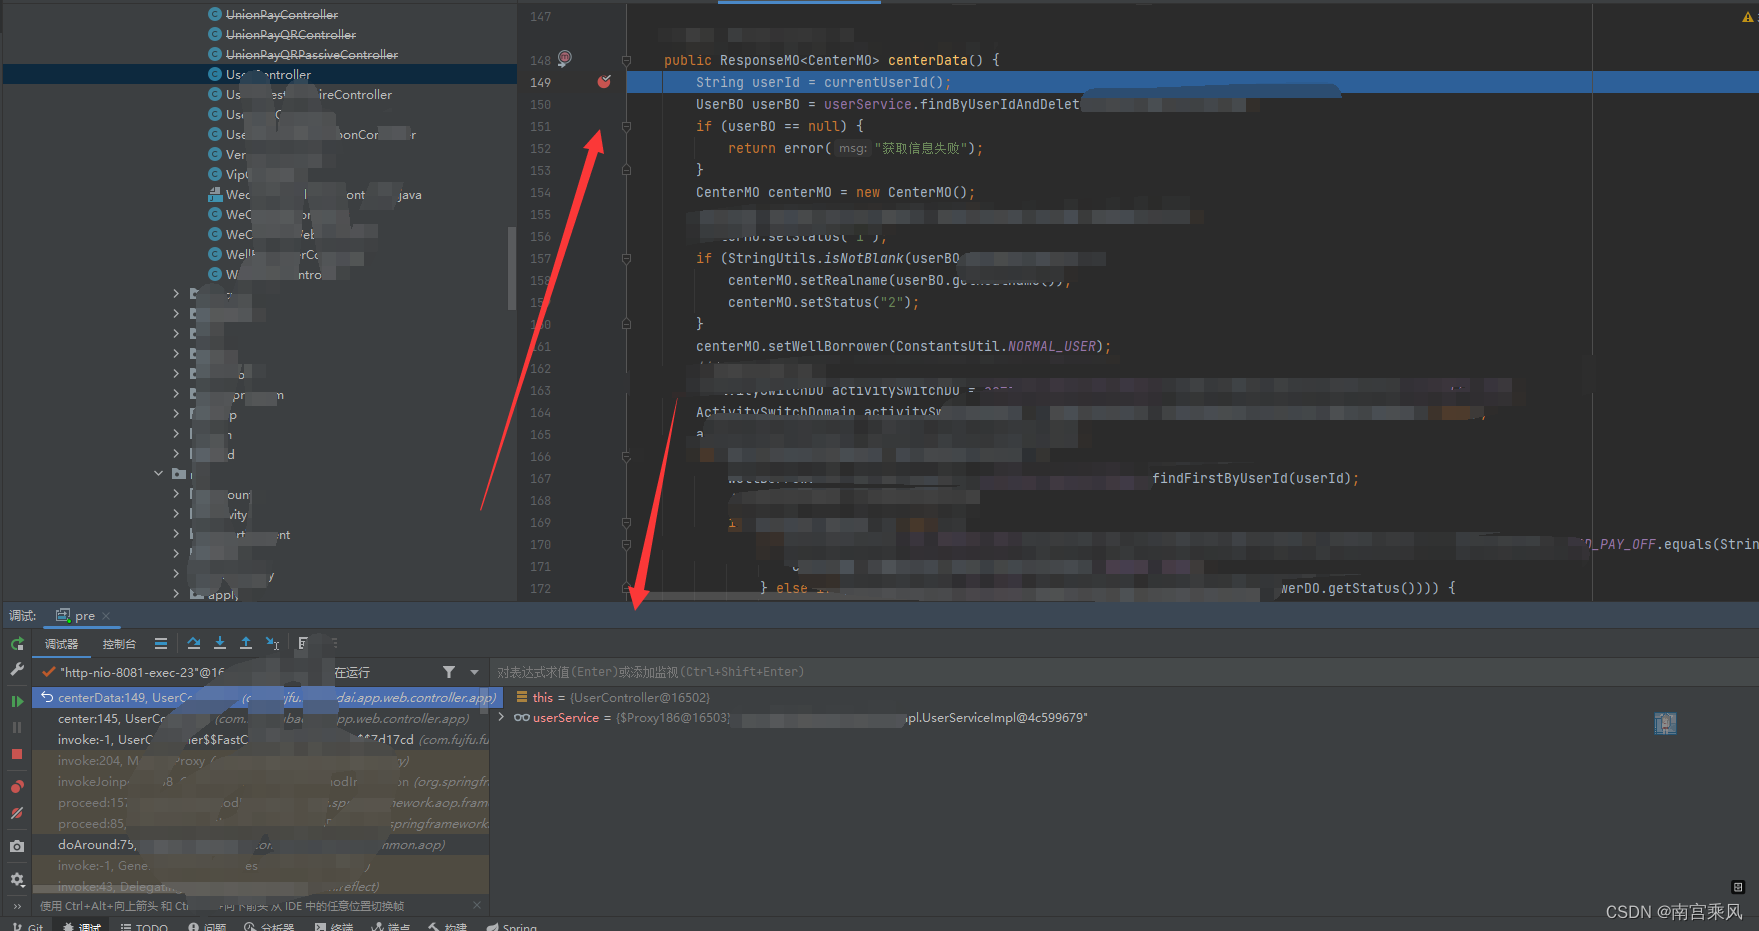
Set breakpoints and begin debugging
After the IDE is attached:
- Set breakpoints in your local IntelliJ IDEA project.
- Trigger the remote application by sending an HTTP request from a browser or mobile client.
- When execution reaches the breakpoint, IDEA will pause there so you can inspect variables and trace the execution flow.
This gives you the same kind of interactive debugging experience you would expect locally, but now against the actual remote runtime.
Common issues and things to watch for
Remote debugging is powerful, but a few details can easily get in the way:
- Keep Java versions aligned. The Java version on the remote server should match the Java version used with IntelliJ IDEA as closely as possible.
- Check firewall rules. The server must allow the debug connection through the chosen port.
- Make sure debugging support is available. The required debugging tools on the server side should already be present, such as
jdbif needed. - Protect sensitive information. During remote debugging, you may inspect runtime values that include passwords, keys, or other confidential data.
- Avoid code mismatches. If you change the code locally, keep the remote deployment in sync. Otherwise, line mappings, breakpoints, and execution flow can become misleading.
For distributed systems in particular, remote debugging can save a large amount of time compared with repeated logging and redeployment. When a problem only appears after deployment, attaching IntelliJ IDEA directly to the running Java process is often the fastest way to understand what is really happening.